.png?width=120&height=77&name=Summit-Virtual-CFO_color_rgb%20(1).png "Summit-Virtual-CFO_color_rgb (1)")


To recap our last blog post in our 4-part metrics series, the key to our clients’ business growth is profit-focused accounting. This accounting approach breaks down revenue into financial and non-financial drivers to help business owners and their financial staff to better understand cash flow. Because once you understand cash flow in and out, you can find the levers at your disposal to help you overcome obstacles and take advantage of business opportunities, ultimately helping you reach your business goals.
How do you measure the success of these levers? Through KPIs.
The key performance indicators (KPIs) we recommend professional services firms track include:
Below we will dive into how to track production metrics for your professional services business and how you can use them to increase profits.
Production
Tracking your production metrics is crucial for two big reasons: first, to see how well your team is doing and second, to predict how much cash flow you can generate. That revenue figure directly affects your forecasts, so it's key to get it right — and boost it if you can.
Utilization Rate
The first production metric we will calculate is utilization rate. The first step to calculating your utilization rate is to determine weekly expectation.
There are 2080 working hours in a calendar year. From total working hours, you subtract non-billable hours like vacations, sick days, continuing education, team meetings, etc. to find total available billable hours. Next, you can calculate the number of weekly billable hours and total available hours per week for each team member. This is your weekly expectation.
Just a heads-up: Different roles might have different billable hours (like project managers billing 20 hours a week while designers might be at 35), so don't be surprised if weekly expectation varies depending on the department and role.
Now that you’ve got the total available hours per week and weekly billable hours, you can figure out your utilization rate! Just divide the billable hours by the total working hours, and you’re set.

Comparing these two metrics will give you a more accurate utilization rate. I'd suggest adjusting your expectations for months with more holidays or PTO, like November and December, to keep your yearly goals achievable.
Bill Rate
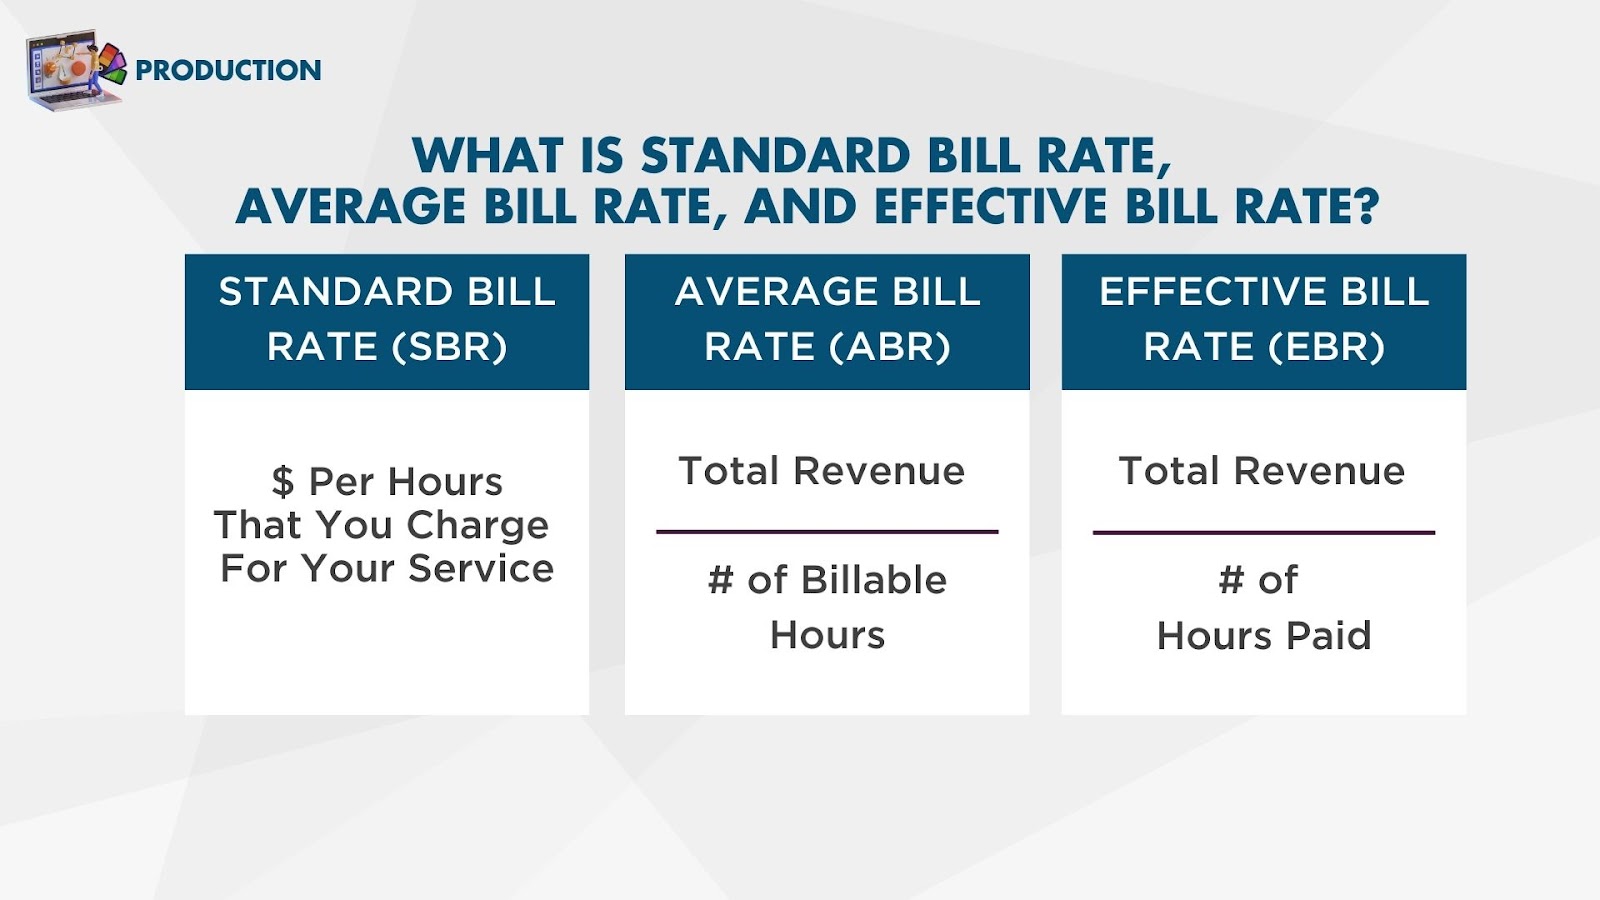
Now, let’s talk about the bill rate. Your standard bill rate is what you include in client quotes, but most of the time, that’s not what you actually receive. What you really need to know is your average bill rate—this is the amount you’re actually getting paid for every hour you bill.
The gap between these two numbers boils down to one thing: write-downs. Write-downs are the hours you work but don’t get paid for. Often, when a project goes beyond the original contract, we’re hesitant to charge the client for the extra time. However, cutting down those hours can hurt your bill rate.
Your average bill rate is the truth teller. To calculate the average bill rate, you’re going to compare how many hours you billed to how many hours worked. From there, you can calculate how much money you’re bringing in for every hour worked.
I’d suggest you aim to keep write-downs under 10% to minimize revenue loss (however, 5% is best practice). Also keep in mind that write-ups (where actual hours are less than estimated) suggest a need to reevaluate pricing.
Next, you can calculate your effective bill rate. This will be your total revenue divided by # of hours paid. This metric is how much is made per hour for a given project regardless of when you’re not working.
The figure below will help you visualize each of these calculations we just went through.
Production Metrics Levers to Pull
Why did we go through all these production metrics? The main goal is to identify any inefficiencies. These metrics can also help you see if your billing rate isn’t matching the value you’re delivering. Raising your billing rate should be a last resort to boost revenue, but sometimes it’s the right move.
First, I’d like to determine if there are any inefficiencies within my team and the work they are doing. Maybe my team is spending way too much time on time tracking because of outdated timekeeping software. In this case, I’d look to implement a time-saving system that will allow my employees to do more work.
Maybe retreats and continuing education are decreasing the amount of projects my team can complete. In this case, I might look for opportunities to condense the time spent on these events. There are many ways to improve inefficiencies, but you have to be willing to do some investigating to diagnose problems.
Let’s look at revenue per producer and revenue per team to set us up for our forecasting levers.
Revenue Per Producer
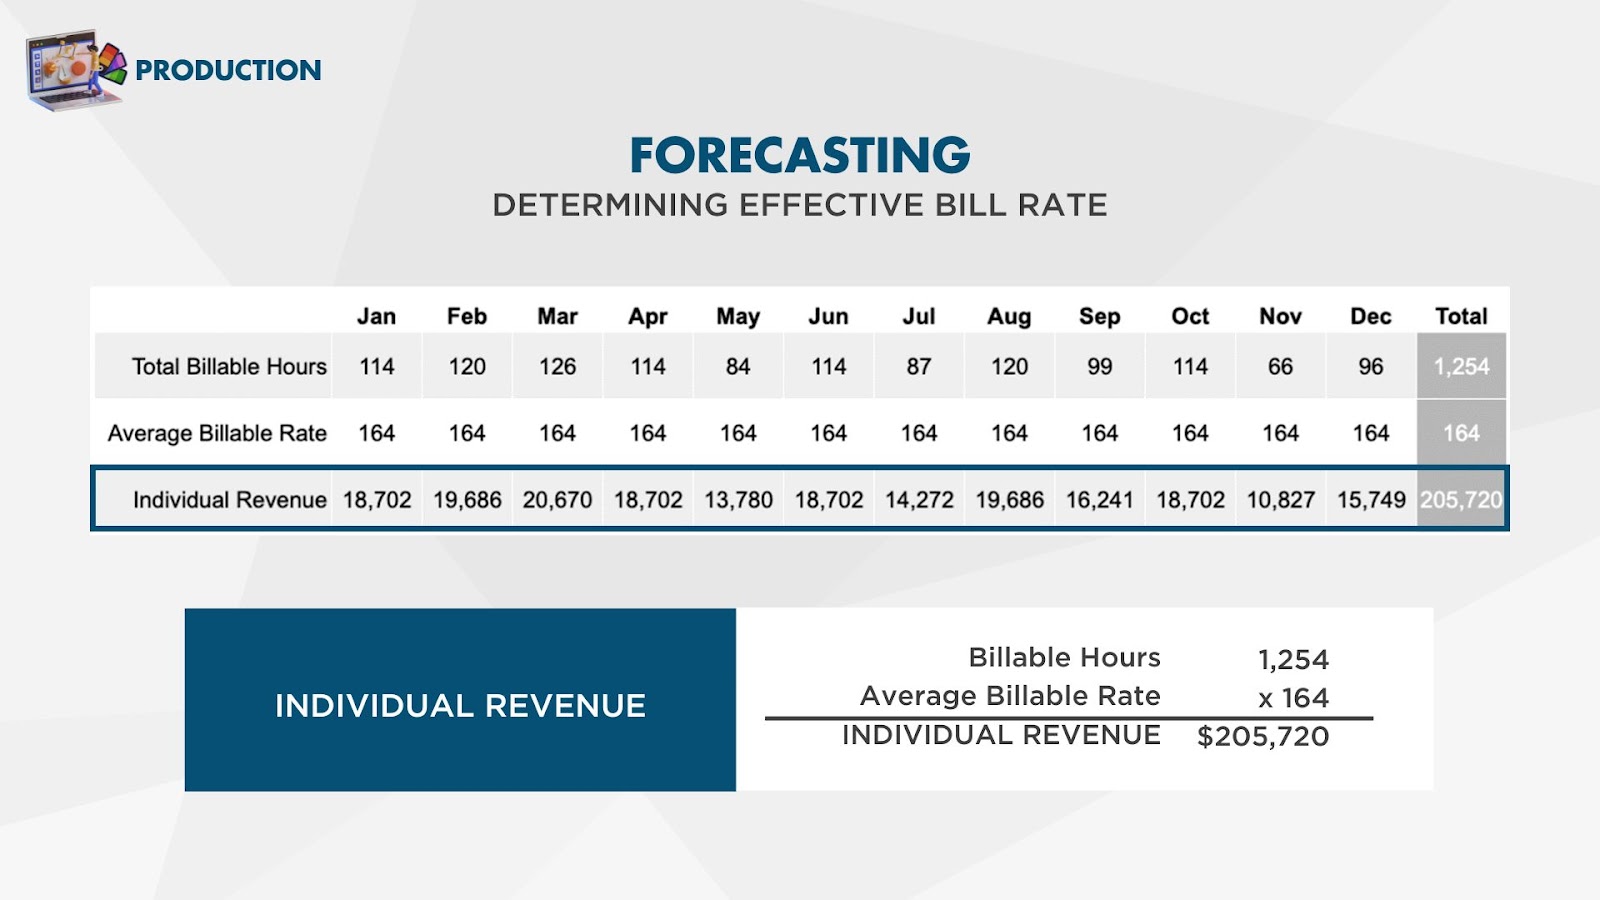
Revenue per producer is where these last few metrics come together. Multiply average bill rate by a staff member’s monthly billable hours to get annual revenue per producer. A typical benchmark is around $200,000 annually per producer, with acceptable ranges between $180,000 and $250,000.
Let’s use this information to calculate team revenue.
Projecting Team Revenue
First, we need to determine FTEs. To determine the full-time equivalents (FTEs), we need to understand how much of each employee's time is billable. For example, if two project managers each spend half their time on billable work, together they count as one FTE.
Next, we’ll multiply the FTEs by each producer's revenue to estimate our monthly and annual revenue. Keep in mind, there will be some fluctuations due to things like vacation time, especially as the year wraps up. Our team deserves their downtime!

After calculating Team Revenue, you’re ready to dive into forecasting and levers hidden in your financial statements...which will be covered in our next two blog posts in our metrics series. Make sure you subscribe to our blog so you are alerted when they publish!
And, if your business needs help with hitting business goals, you can sign up for a virtual CFO consultation to learn about how we help our clients set KPIs, pull levers when necessary, and set SMART goals.