.png?width=120&height=77&name=Summit-Virtual-CFO_color_rgb%20(1).png "Summit-Virtual-CFO_color_rgb (1)")


Did you know there are hidden business levers in your financial statements? That’s right. By fully understanding your financial statements inside and out, you can identify methods to alter your business cash flow. But that first part of that last sentence is key: you need to fully understand your business financials (which can seem pretty hard if you don’t break your financial metrics down into digestible pieces of information).
That’s why we use the profit-focused accounting approach with our clients. It’s a system designed to help business owners accomplish their financial goals by breaking revenue down into financial and non-financial drivers. Using these drivers, we can then create SMART goals (specific, measurable, achievable, relevant, and timely). For example, to design x number of websites, or sign x amount of new client work in 6 months.
Metrics can also be called key performance indicators (KPI). There are four KPIs we specifically recommend professional services firms track:
| Cash | Production |
| Financial |
In this post, we are going to focus on financial statement metrics, but if you’d like to learn more about the hidden levers in your cash and production KPIs, go back and read those posts. Before we get into the details, we’d like to call out that graphics and tables are for example only. These should not be taken as industry averages.
Financial Statement Metrics
Let’s start by uncovering hidden financial levers in your real-time forecast. If you’re not sure what a real-time forecast is, check out our “What Is Cash Flow Forecasting” post.
Real-Time Forecasting Levers
To understand the levers you can pull through cash flow forecasting, we first need to decide on your net income goals.
As a service-based business, you will want to aim for a net income of no less than 10%, but you will probably want to aim for a better goal of 25%. While this percentage would be different for a product-based business, this range is best practice for a service-based business. Smaller businesses might achieve higher percentages of up to 40% because of lower overhead, larger businesses might have lower net income percentages, but the total dollar amount can be significantly higher, providing more resources for growth and employee raises.

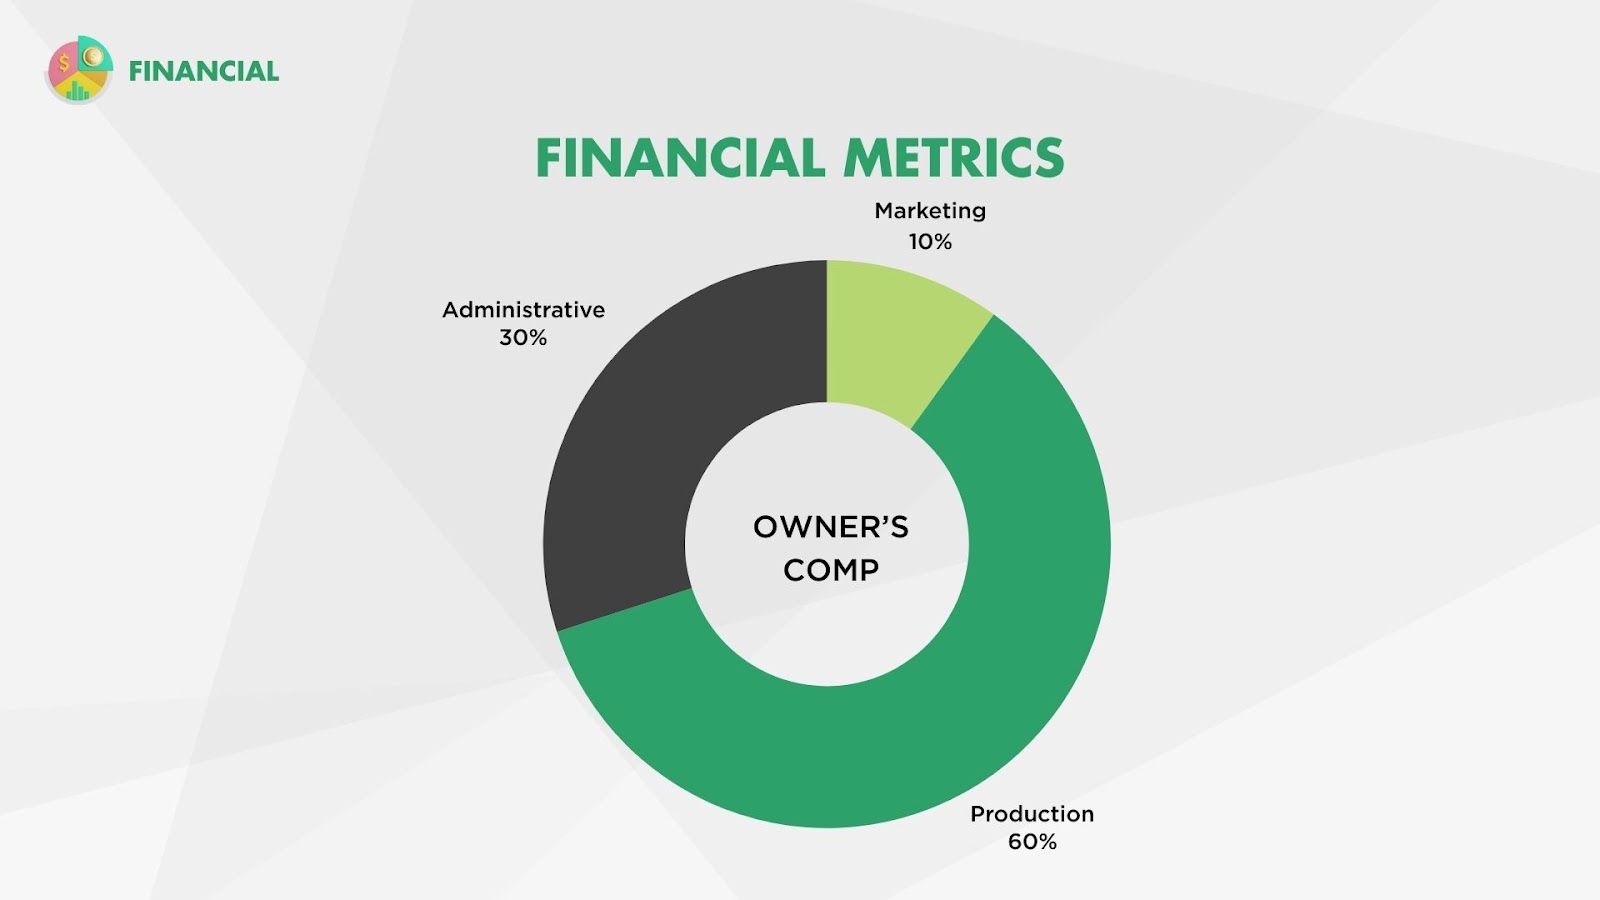
Your next step is to categorize expenses, breaking them down into four categories: production, administrative, marketing, and facilities. One lever your forecast may be hiding is optimizing costs in these three categories. Are you spending too much money on certain marketing strategies that aren’t proving successful? Are you hiring too many producers when there isn’t enough billable work? Is your facility far too big or small for production? Once we have all expenses categorized, we can compare each of these expense categories with industry benchmarks.
Next, we analyze production costs. This includes producer salaries and employee burdens like benefits, insurance, and taxes. Employee burden typically adds 20% to an employee’s base salary.
To calculate production costs accurately, you need to calculate effective cost and effective rate:
-
Effective Cost: Your effective cost will be the total cost of your production team divided by total hours they’ve worked. For instance, if you have 17 producers working 2080 hours each per year, with an effective cost of $46/hour, your total production cost is $1,626,560.
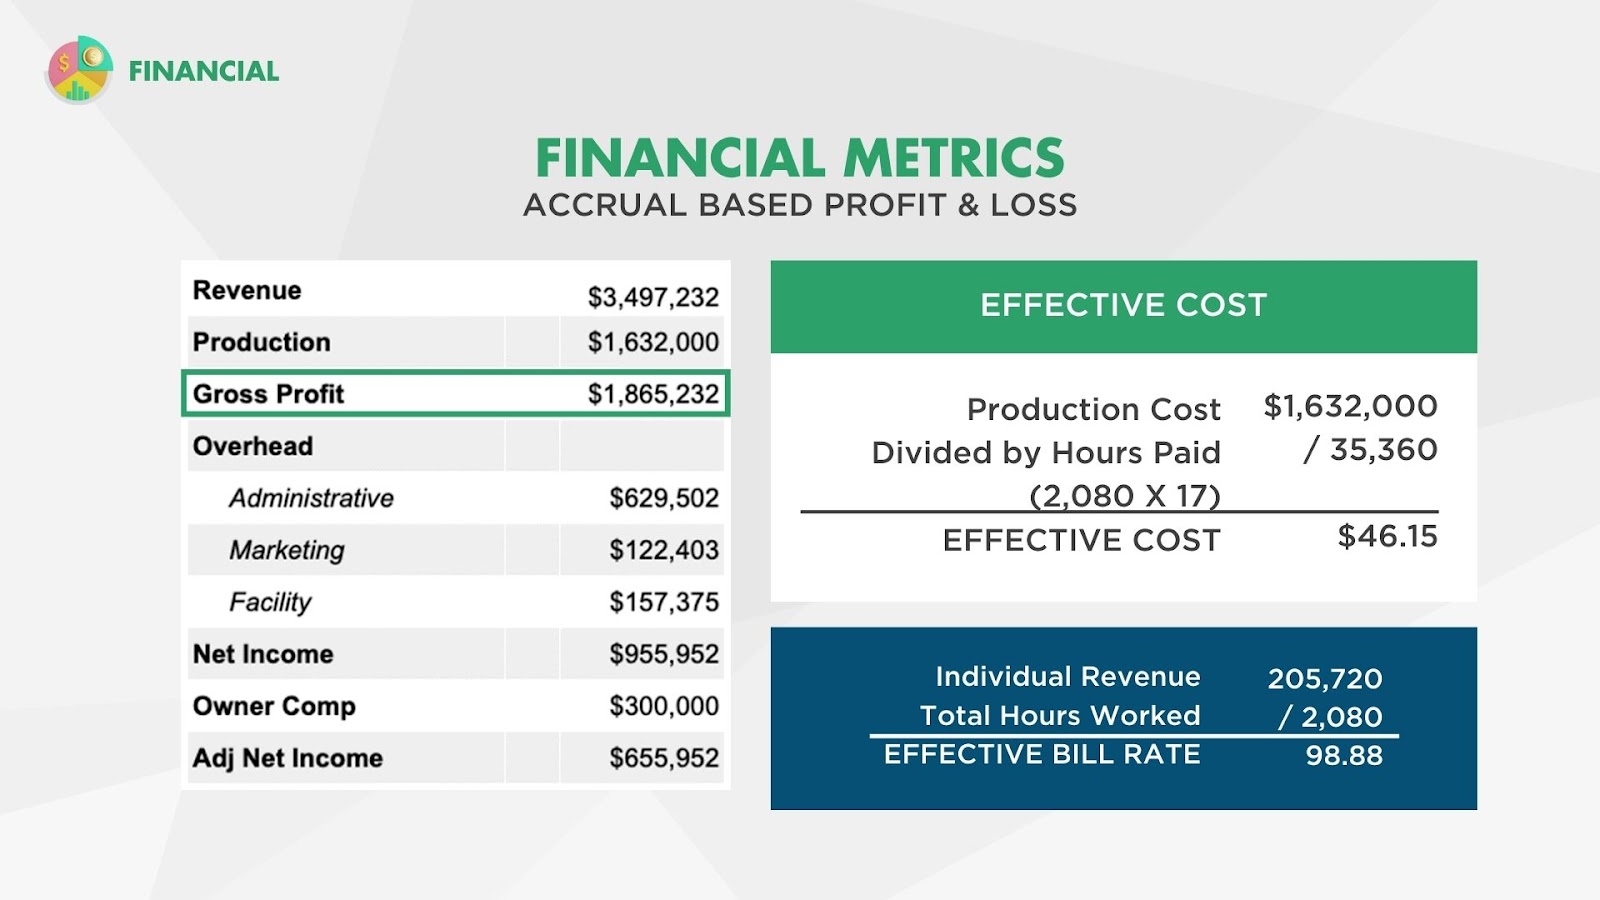
-
Effective Bill Rate: Remember, this is how much you charge clients per hour of work, which impacts gross profit. Your effective bill rate should generally be a bit more than double your effective cost to maintain a healthy gross profit margin.
On that note, your gross profit margin is a key business metric and should range between 45-65%. Calculate gross profit margin by subtracting production costs from revenue, aiming to maintain or improve this margin for financial health.

Managing your net income is one way you can keep things on track. For example, if you’re aiming for a 25% net income on $10 million in revenue, that leaves you with $7.5 million to cover costs. You can spread that money across different departments, but if you decide to put more into one area, like marketing, you’ll need to cut back somewhere else, like production.
Net Income
One way to gauge your company’s health is by looking at your net income. Let’s check if your net income percentage is where it should be.
First, you need to figure out what your net income should be. For a service-based business, it typically falls between 10-25% of revenue. Check industry averages to set the right net income target for your company. If you’re not meeting the industry average, it will be tough to fund your business, and you might end up struggling with cash flow, living payroll-to-payroll. Your goal should be to reach this range as soon as possible.
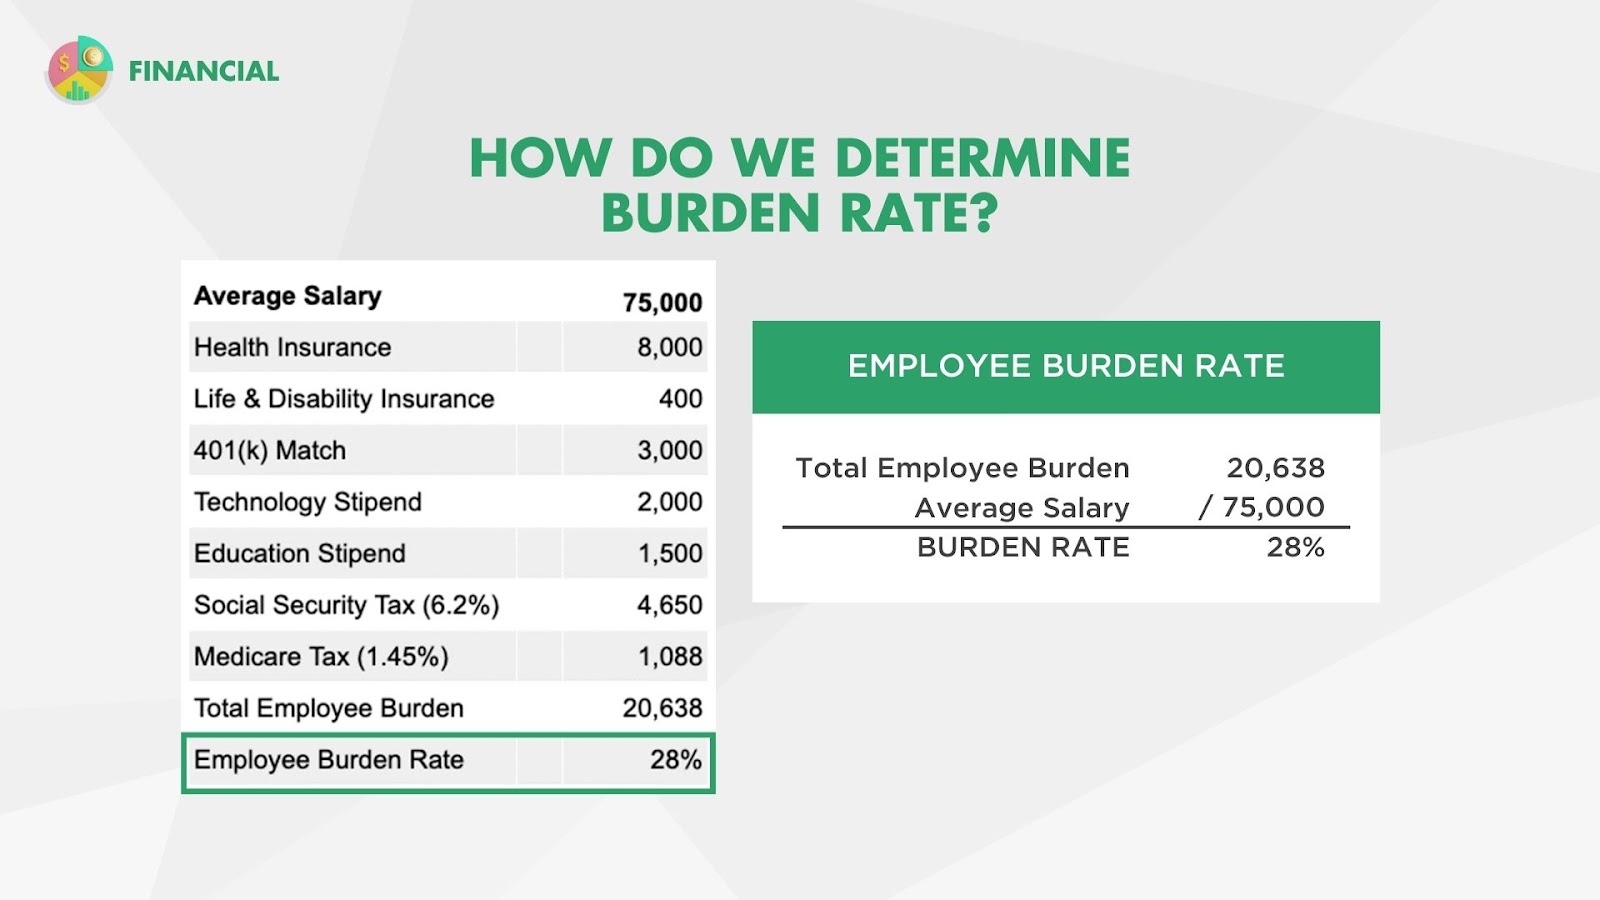
You’re probably asking, how do I calculate that net income percentage? It’s actually pretty simple. First, we calculate your annual production. This will be:
Average salary x burden rate x number of team members = annual production

Now, if you don’t know your burden rate, take the average employee burden (add up all expenses beyond actual salary) divided by average salary. If you remember, employee burden generally adds 20% to an employee’s cost, but again, this is an estimate. I highly suggest that you go through this exercise to calculate your own company’s burden rate.

Once you have your annual production number, subtract annual production from revenue to get your gross profit.
After calculating gross profit, you will calculate overhead costs. These would be administrative, marketing, and facility costs. Now, subtract overhead from your gross profit to get your net income.
Finally, subtract owner compensation from net income. This will give you a net income before and after owner compensation making it easier to compare from company to company.
Then, take net income and divide by revenue to get your net income percentage.
This may sound complicated, but the diagram below illustrates everything we just walked through visually.

Now you can compare whether your net income percentage falls into that healthy 10-25% range. If not, it's time to optimize your overhead costs.
I hope this blog post helped you see into the different metrics and health gauges hidden in your financial statements. To learn more about how we make our agency clients more profitable and support them in reaching business goals, check out our virtual CFO services.